This guide is a walkthrough to integrate RealOpInsight with a Nagios, Icinga, Centreon, or similar systems source.
At the end of this guide you will see how RealOpInsight provides easy yet powerful alternative federation and application operations monitoring dashboards for Nagios, Icinga, Centreon and the other derived systems.
Requirements
The below steps assume that:
- You followed the Getting Started Guide to set up an instance of RealOpInsight.
- You have a running instance of Nagios, Icinga, Centreon, or any similar system.
- You have a network-based Livestatus access to your monitoring data. It’s worth noting that Icinga 2 provides a reimplementation of the Livestatus protocol that you can easily enable.
Use cases
In this section we’ll show a basic use cases of RealOpinsight, and then provide you links to move forward with more advanced use cases.
Autodiscovery & Host Group-based Dashboards
As a first and very simple way to get started with RealOpInsight and Nagios (respectively Icinga, Centreon…) is to use the automatic discovery and mapping capabilities of host groups from Livestatus service. Indeed, after a successful configuration of your Livestatus source, RealOpInsight will automatically discover all monitored host groups in Nagios (respectively Icinga, Centreon…) and use them to create infrastructure-focused operations dashboards organized as below.
hostgroup
  |
  +---host1
  |        |
  |        +--check1
  |        |
  |        +--check2
  |        |
  |        +--...
  +---host2
  |        |
  |        +--check1
  |        |
  |        +--check2
  |        |
  |        +--check3
  |        |
  |        +--...
  |
  |---...
You must note the tree-based relationships, that’s the foundation what is called Application Dashboard in RealOpinsight terminology. You will be able to see how it works when going further in this document.
Executive Dashboard
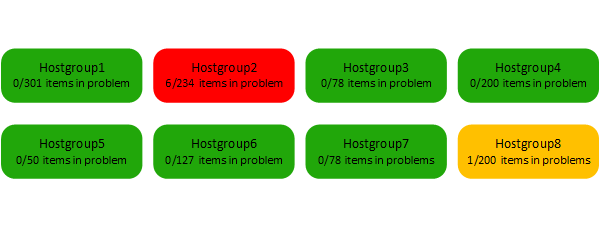
Ultimately, RealOpInsight allows you to setup monitoring views per operator basis that can be watched at the highest level as below. Each icon is associated, via a click, to an Application Dashboard.
This high level view of a monitored environment is called Executive Dashboard in RealOpinsight terminology. In you setup host group-based dashboards, you will be able to have Executive Dashboards looking as hereafter. You will be able to see how that works when going further in this document.
It’s worth to note that, this automatic group discovery and mapping feature is a very basic way to build and operate operations monitoring views using RealOpInsight. Its Web Editor offers richer and advanced features to allow you to build specific and highly customizable service trees to address your specific operations monitoring needs.
First Steps with Application Dashboard
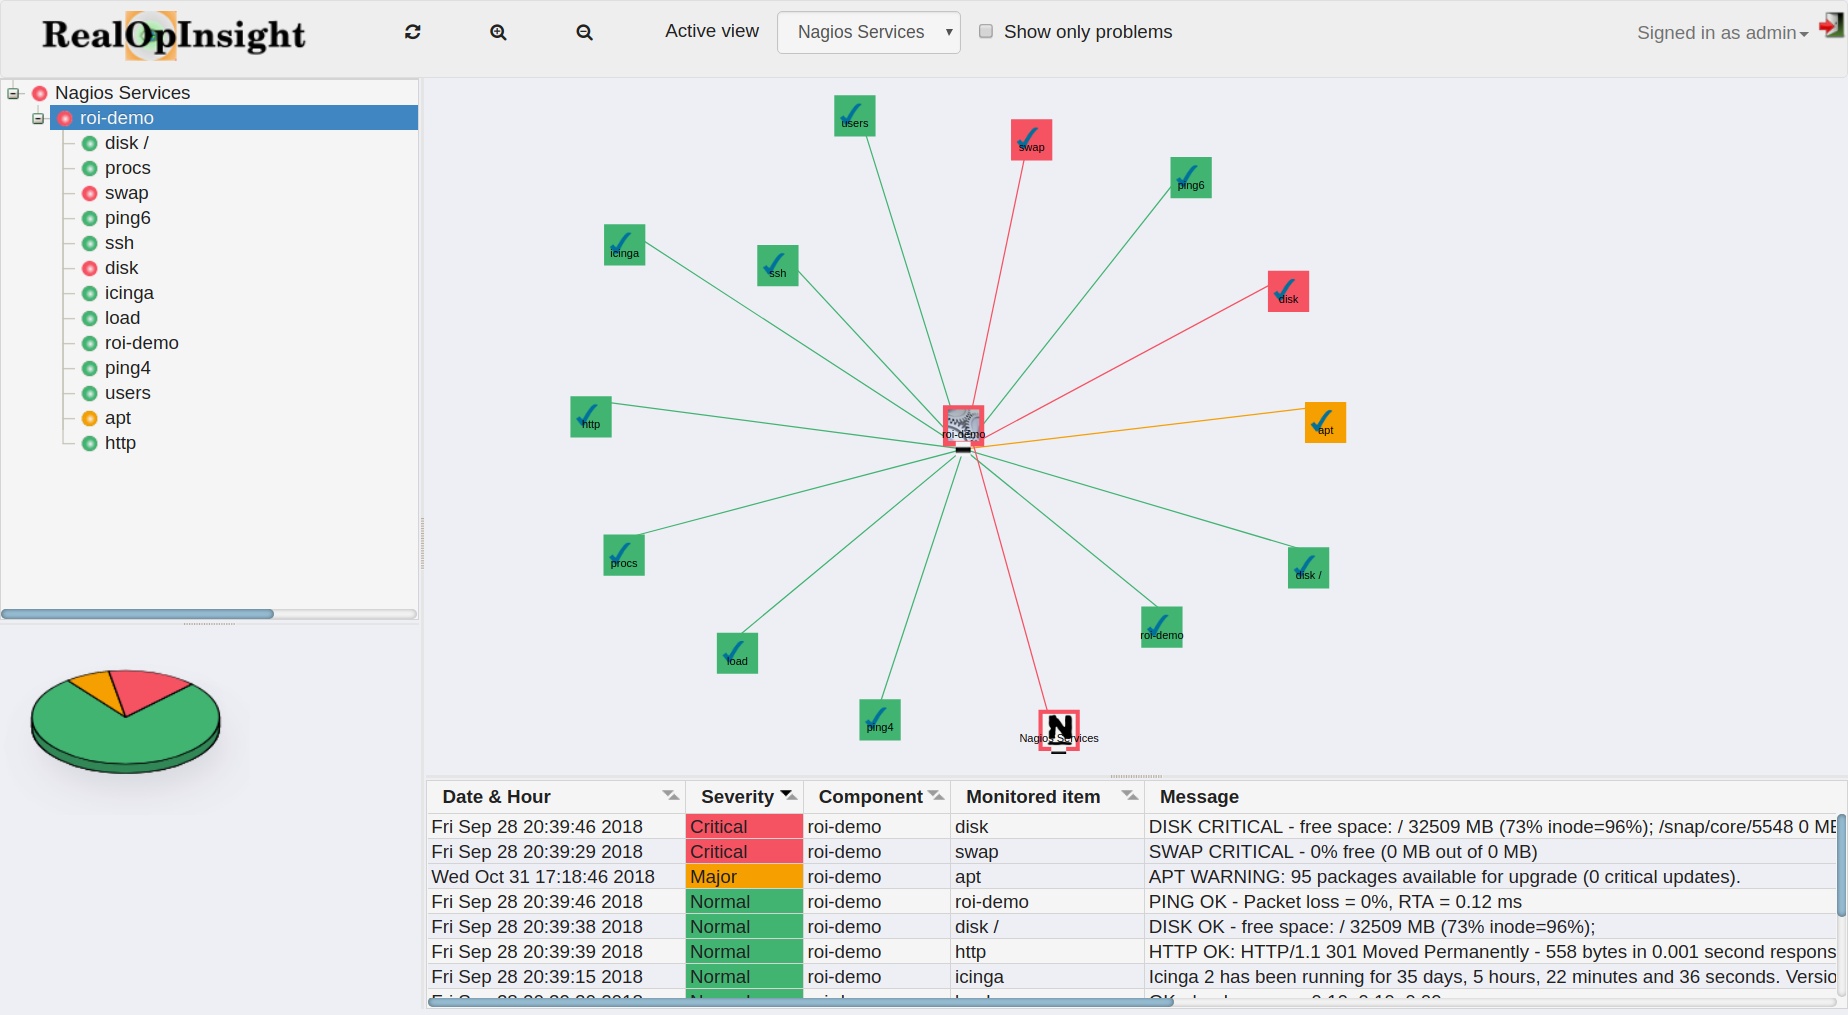
One of key visualization concepts that RealOpInsight introduces is Application Dashboard, as illustrated on the figure below. It provides to administrators and operations staffs a comprehensive view of an application platform through: a Service Tree and a Service Map that represent services along with their dependencies; a Message Panel where status messages related low level services are displayed. In short, an Application Dashboard provides a flexible tool that simplifies incident impact analysis.
Please read Overview about Application Dashboard if you needed more details.
Preview Application Dashboard as Administrator
As administrator you can preview and check the Application Dashboard for any single operation view before assigning it for operations.
- Log into RealOpInsight as administrator.
- Select the menu
Operations Profilesto see the list of managed views. - Select the menu
Preview. - Select an entry in the list of managed views (e.g. select the entry you created above).
- Click on
Applyto display the Application Dashboard. - Click on the button
 to refresh the views (service map, service tree, message panel).
On this example we can see that there are problem on three items. The impact of each event is easily is highlighted using the tree view, the service map and the event console.
First Steps with Executive Dashboard
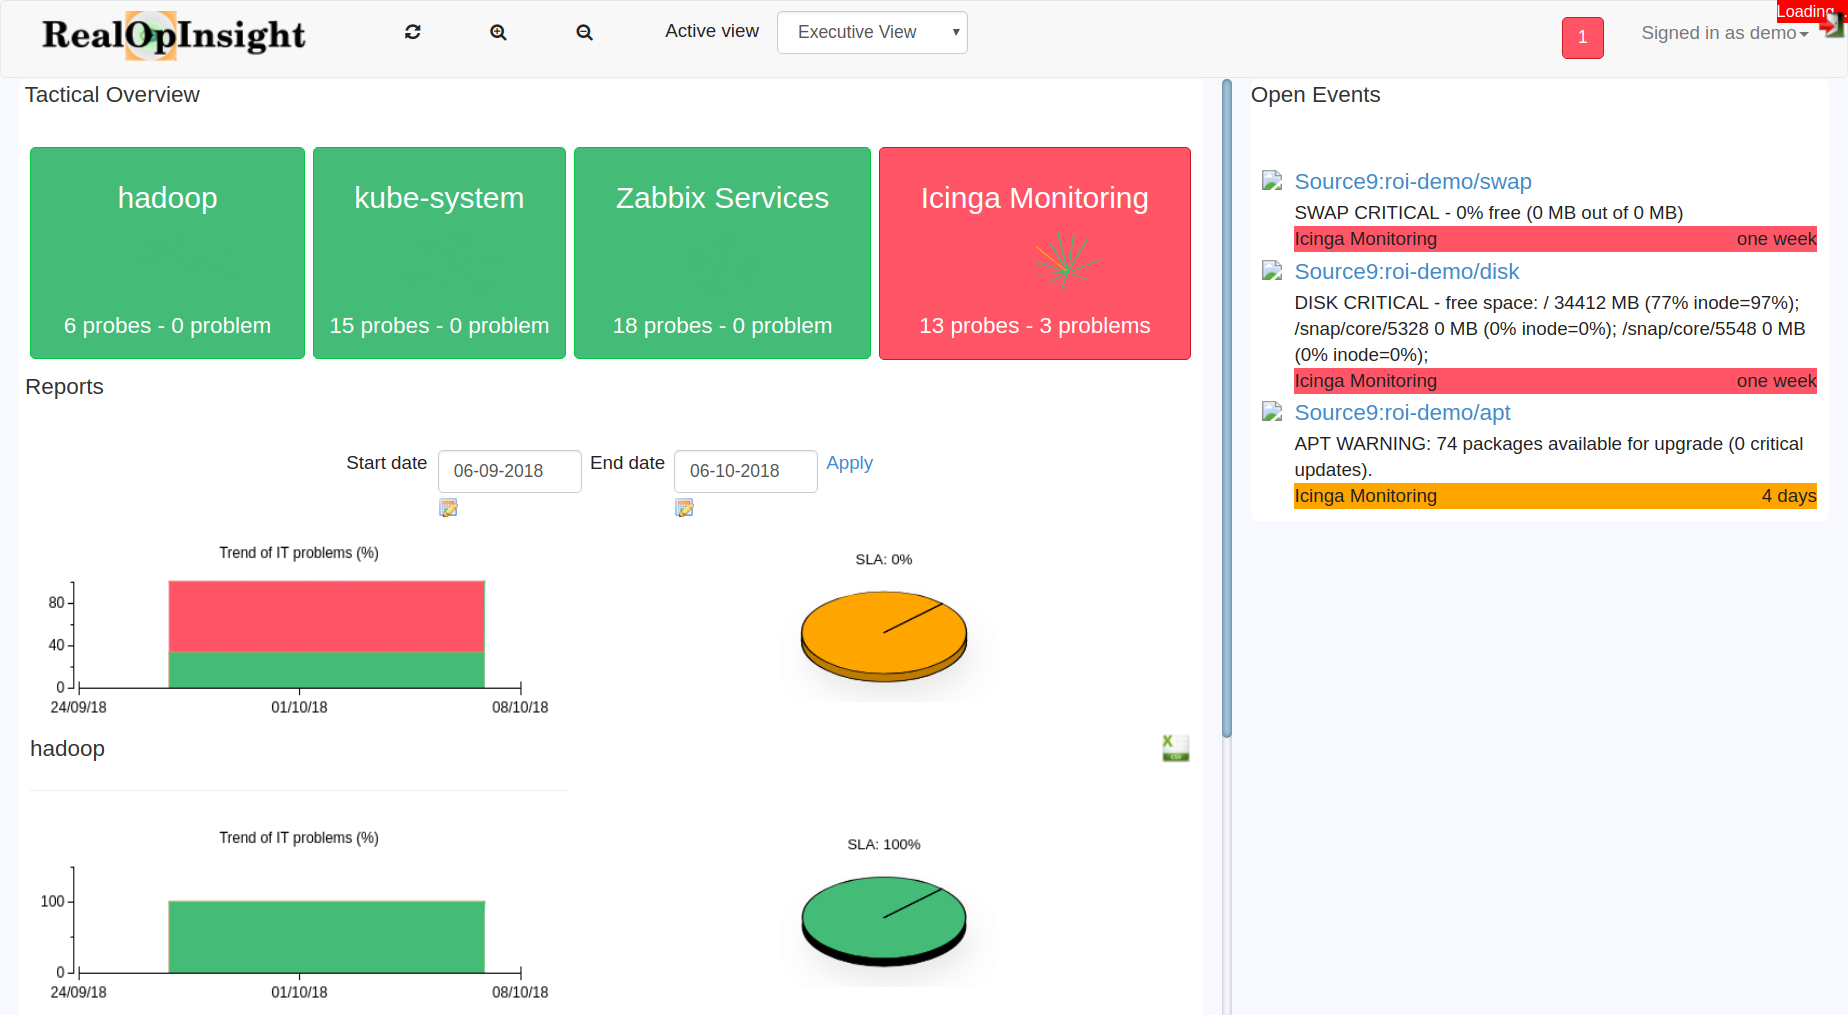
As a user defined as Operator in RealOpInsight, you have access to an Executive Dashboard that acts as home page on login. The Executive Dashboard can consist of no, one, or many items as illustrated by the following screenshot. It’s organized like a grid with configurable number of columns. The items displayed in the Executive Dashboard should be explicitely assigned to the operator by a user having administrator role in RealOpInsight.
Please read Introduction about Executive Dashboard if you need more details.
The rest of this section will describe how to create Executive Dashboards and use them.
Create a Operator User
- Log into RealOpInsight as administrator.
- Select the menu
New User. - Fill in the user information:
- Password must have at least six (6) characters in two classes (upper/lower cases, digits, special characters, etc.).
- Ensure to select
OperatorasUser Role. - The property
Dashboard Tiles Per Rowallows to set the number of columns for the Executive Dashboard.
- Click on
Submitto save the changes.
Assign Operations Views
- Log into RealOpInsight as administrator.
- Select the menu
Operations Profiles. - Select an operator in the user selection list at left.
- Select one or several items in the list of business applications at the right.
- Cick on
Assignto apply the changes.
Operate Executive Dashboard
- Log in as operator
- On login the operator Executive Dashboard will be displayed with the items assigned to him.
- You can select a tile to displat the associated Application Dashboard.
- When an Application Dashboard is active, you can select
Executive Viewto go back to the Executive Dashboard.
This is the end of this quickstart of RealOpInsight, please follow the below links to move forward with advanced use.
Related Links
- For other installation options please see our complete Installation Guide.
- For integration with other monitoring systems (e.g. ManageEngine OpManager) read our Monitoring Sources Integration Guide.
- If you want to learn more about RealOpInsight basics, it’s here.